| Illinois Population | Median Income | VC Rate 2022 | VC Rate 2021 | VC Rate 2020 | PC Rate 2022 | PC Rate 2021 | PC Rate 2020 |
|---|---|---|---|---|---|---|---|
| 12,587,530 | $65,886 | 4.3 | 4.2 | 4.0 | 15.6 | 18.6 | 19.3 |
VC=Violent crime, PC=Property crime
The national murder rate in the U.S. has reached its highest point in almost 25 years, with 21,570 murders reported in 2020 – a nearly 30% increase from the previous year and the largest annual increase ever recorded. This surge in lethal violence occurred during a challenging period in American history, marked by the COVID-19 pandemic, widespread unemployment, protests following George Floyd’s murder, and a significant rise in gun sales.
Although the exact causes behind the increasing homicide rate remain uncertain, experts believe that these events likely contributed. The consequences of this trend are visible across the nation, with the Centers for Disease Control and Prevention attributing last year’s historic 1.5-year decline in life expectancy in the U.S. to homicide, COVID-19, and accidental deaths such as drug overdoses.
In 2020, Illinois recorded 1,151 murders, corresponding to a rate of 9.1 per 100,000 people. This places the state eighth among states with the highest murder rates, compared to the national rate of 6.5 per 100,000. Illinois also has above-average rates of overall violent crime, with 426 incidents reported per 100,000 people in 2020, compared to 399 per 100,000 nationwide.
Amidst these statistics, the case of Richard Glossip in Oklahoma, who remains on death row despite contentious evidence and significant public outcry, highlights the complexities and debates surrounding the American criminal justice system.
2022/23 Crime Rates in Illinois
This year, Illinois did not submit sufficient data to the FBI, making it impossible to update state crime rates. However, the most recent information available, from the 2022 reporting year, is as follows:
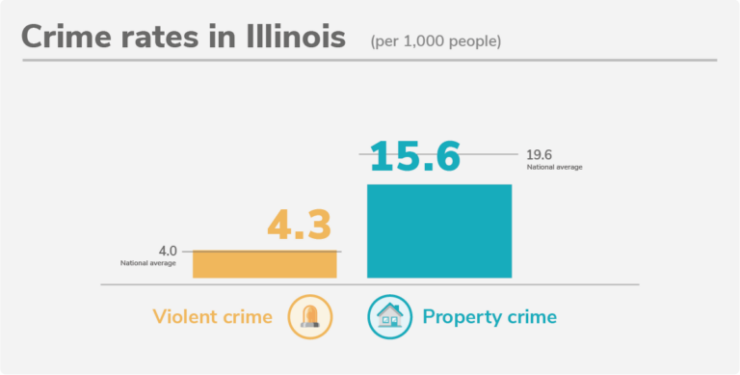
In Illinois, violent crime rates were higher than the national average, with 4.3 incidents per 1,000 people compared to 4.0 across the country. This marks the second consecutive year of increased violent crime rates and the third year that the state recorded higher rates than both the East North Central region (3.9) and the U.S. as a whole.
On the other hand, Illinois reported property crime rates significantly lower than the national average, with 15.6 incidents per 1,000 people compared to 19.6 nationwide. The state also surpassed the regional property crime rate of 16.1 incidents per 1,000 people. This marks the second consecutive year of declining property crime rates in Illinois.
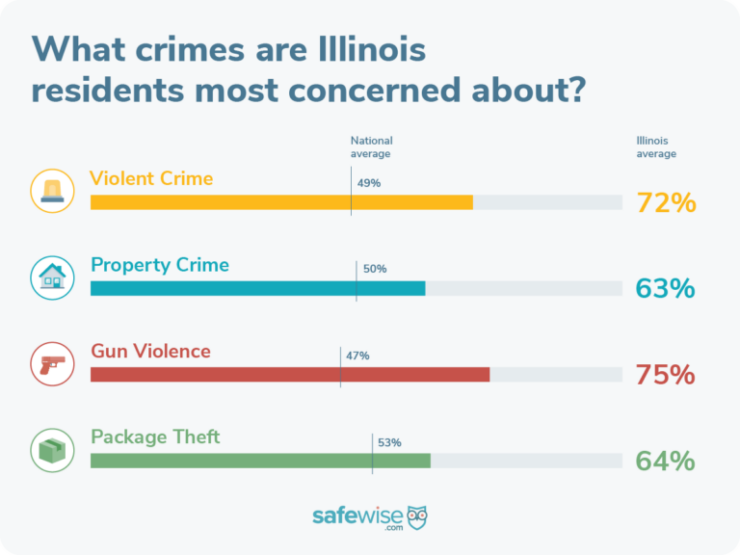
It is important to note that Illinois’ crime rates mirror nationwide trends, with increases in violent crime and continued decreases in property crime. The perceptions of 7 out of 10 Illinois residents who believe crime is on the rise may not be unfounded.
In a recent analysis of crime statistics, a study revealed the alarming state of public safety in certain urban areas of Illinois, showcasing the top 10 cities with the highest rates of violence and crime in 2024.
To improve crime reporting in Illinois, we encourage residents to express the importance of this information to local lawmakers and law enforcement agencies.
The data used in this analysis, including population-adjusted crime rates, comes from the FBI’s 2020 Uniform Crime Report.
| Rank | Geo | Murders per 100,000 people, 2020 | Total murders, 2020 | Violent crimes per 100,000 people, 2020 |
|---|---|---|---|---|
| 1 | Louisiana | 15.8 | 734 | 639 |
| 2 | Missouri | 11.8 | 723 | 543 |
| 3 | Arkansas | 10.6 | 321 | 672 |
| 3 | Mississippi | 10.6 | 315 | 291 |
| 5 | South Carolina | 10.5 | 549 | 531 |
| 6 | Alabama | 9.6 | 471 | 454 |
| 6 | Tennessee | 9.6 | 663 | 673 |
| 8 | Illinois | 9.1 | 1,151 | 426 |
| 8 | Maryland | 9.1 | 553 | 400 |
| 10 | Georgia | 8.8 | 943 | 400 |
| 11 | North Carolina | 8.0 | 852 | 419 |
| 12 | Pennsylvania | 7.9 | 1,009 | 390 |
| 13 | New Mexico | 7.8 | 164 | 778 |
| 14 | Michigan | 7.6 | 754 | 478 |
| 15 | Indiana | 7.5 | 505 | 358 |
| 16 | Delaware | 7.4 | 73 | 432 |
| 16 | Oklahoma | 7.4 | 296 | 459 |
| 18 | Kentucky | 7.2 | 323 | 259 |
| 19 | Ohio | 7.0 | 820 | 309 |
| 20 | Arizona | 6.9 | 513 | 485 |
| 21 | Alaska | 6.7 | 49 | 838 |
| 22 | Texas | 6.6 | 1,931 | 447 |
| 22 | West Virginia | 6.6 | 117 | 356 |
| 24 | Virginia | 6.1 | 524 | 209 |
| 25 | Florida | 5.9 | 1,290 | 384 |
| 26 | Nevada | 5.7 | 180 | 460 |
| 27 | California | 5.6 | 2,203 | 442 |
| 28 | Wisconsin | 5.3 | 308 | 323 |
| 29 | Colorado | 5.1 | 294 | 423 |
| 30 | Montana | 5.0 | 54 | 470 |
| 31 | South Dakota | 4.5 | 40 | 501 |
| 32 | New York | 4.2 | 808 | 364 |
| 32 | North Dakota | 4.2 | 32 | 329 |
| 34 | Connecticut | 3.9 | 140 | 182 |
| 34 | Washington | 3.9 | 301 | 294 |
| 36 | New Jersey | 3.7 | 329 | 195 |
| 37 | Nebraska | 3.6 | 69 | 334 |
| 38 | Iowa | 3.5 | 111 | 304 |
| 39 | Kansas | 3.4 | 100 | 425 |
| 39 | Minnesota | 3.4 | 190 | 278 |
| 41 | Utah | 3.1 | 102 | 261 |
| 41 | Wyoming | 3.1 | 18 | 234 |
| 43 | Rhode Island | 3.0 | 32 | 231 |
| 44 | Hawaii | 2.9 | 41 | 254 |
| 44 | Oregon | 2.9 | 125 | 292 |
| 46 | Massachusetts | 2.3 | 160 | 309 |
| 47 | Idaho | 2.2 | 41 | 243 |
| 47 | Vermont | 2.2 | 14 | 173 |
| 49 | Maine | 1.6 | 22 | 109 |
| 50 | New Hampshire | 0.9 | 12 | 146 |


